I provide consultancy services to local government in relation to school place planning, school capital projects, and other senior (AD/Head of Service) level functions. I am also a demographer and researcher, attached to the multi-university Centre for Population Studies based at the University of Southampton, developing new models for local population forecasting.
In certain respects local government in England is very durable. Some cities or boroughs have charters dating back manmy centuries. Southampton will appoint its 799th mayor next month. Although the geographical definition of Southampton and the powers vested in the mayor, burgesses, corporation, and council of Southampton have changed many times, there is a real continuity. In certain respects local government has a longer history than some aspects of national government.
However in other respects local government arrangements can seem very fragile: its duties and powers are constantly changing, there are frequent restructures and renamings. Indeed, yesterday there were some important changes in several areas. By convention, and to align with the local government financial year, such restructurings take place on 1st April – April Fools Day. The non-metropolitan county of Northamptonshire and all the district councils within it were abolished yesterday. Two new unitary councils were formed: North Northamptonshire, comprising the former districts of Corby, East Northamptonshire, Kettering and Wellingborough; and West Northamptonshire, comprising the former districts of Daventry, Northampton and South Northamptonshire. This followed a major financial crisis at Conservative-led Northamptonshire County Council.
Other areas have been reorganised recently: Dorset, Somerset and Suffolk in 2019, and Buckinghamshire in 2020. These have tended to reduce the number of councils, and often to replace a two-tier system with a single-tier unitary system in which all local services and powers are held by a single council. Sometimes council’s change their name: for example Shepway became Folkestone and Hythe. Usually this is to replace an obscure name with one using more familiar geographical features: such as the principal town(s).
Whilst there is often a good reason for such changes, it would not be true to say that consistent principles have been applied over the past 25 years. Constant change tends to create the impression that all local government arrangements are provisional and can be changed on a whim. Some stability and a clear definition of the constitutional role of of local government in England would be welcome….. in my opinion.
In an earlier post I explained how the sudden reversal in school pupil numbers got me interested in demography. After what seemed like a couple of decades of falling rolls numbers started rising. As a local authority senior education manager I had been involved in closing and amalgamating schools as they became unviable. To a large extent, our work was about planning for contraction. When it became apparent numbers were rising I wanted to understand more.
I often acquire books by browsing in bookshops – real physical ones. It was at about that time that this caught my eye:
Kenneth W Gronbach (2008) The Age Curve
It looked interesting so I took it from the shelf and started reading. The full title was The Age Curve: How to Profit from the Coming Demographic Storm.
It was by an “internationally recognised expert in the field of demography and generational marketing who counsels both Fortune 500 and small businesses across the country.” Clearly American, clearly marketing oriented, but hey, if there was a coming demographic storm I wanted to know about it, be ready for it, and maybe even profit from it. I parted with £13.99 and took it home to read.
The thesis is simple: the American population is divided into “generations” that had different early experiences (war/peace; growth/recession; etc.) and each was a different market segment. What was new was Gronbach’s linking of this to the numbers born (in the US) into each generation. The GI generation (1905 to 1924) was relatively numerous – at least when they were born. They were the ones who fought in WW2. The silent generation (1925 to 1944) was small. They were mostly to young to fight in WW2 – they didn’t have war stories to tell, so they mainly kept quiet. Then there were the baby boomers 1945 – 1964. There were lots of them. They were born in a time of (relative) peace. Their parents were the GI generation. They benefited from post-war growth, and liberalising social attitudes. they still run much of the world. Generation X (1965 to 1984) was much smaller – their parents were the correspondingly small silent generation. Their market clout was not so great, simply because they were few in number. And then Generation Y (1985 – 2004) – the baby boomers kids – another big generation. Gronbach states: “The generational sections vary dramatically in size. This fact makes their consumption habits very predictable. Big ones need more food and bicycles. Little ones will eat and ride less.” This can be linked to preferences for all kinds of consumer products, and can potentially explain why sales of some slump while others boom.
No doubt there is a lot of room for debate around these ideas, including whether these generations really exist in any real sense. But these waves of population may explain the relative and changing balance of sales of Harley Davidsons and Hondas, this or that beverage.
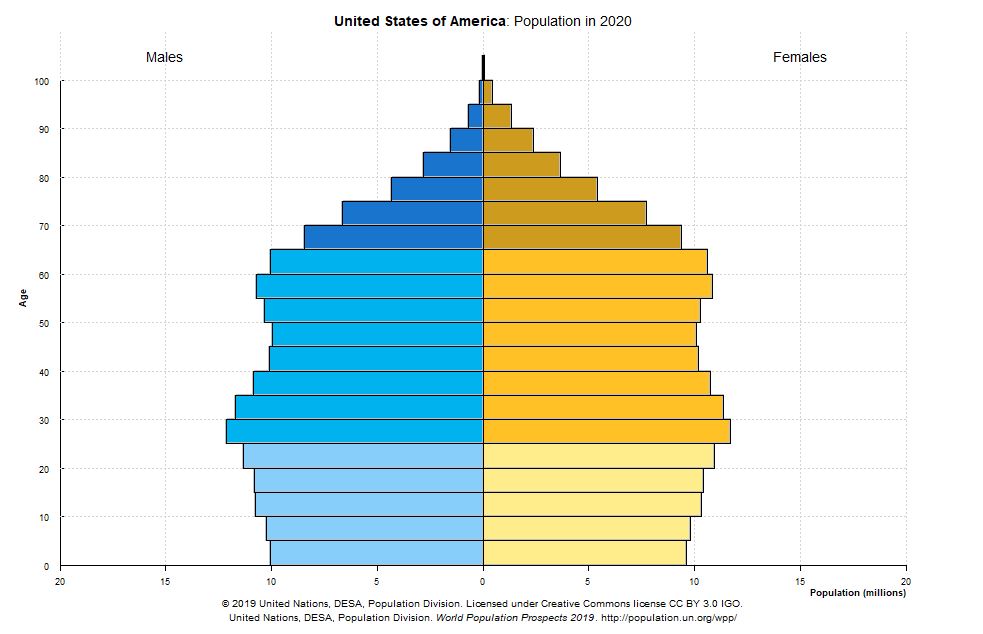
I checked the age profile of births in England and Wales, and the resulting population pyramids. They are not quite the same as the US – but there are similarities as these pyramids taken from the UN website show.
I found Gronbach’s theory interesting, and persuasive – but then he is an internationally recognised marketing expert, so that’s his job. But whether you buy all the generation theory or not, clearly the waves of larger and smaller cohorts will have a big impact on services that are very specific to particular age groups. And nothing is more age specific than schooling: it’s all set out in law -in England and Wales a child becomes of statutory school age the term following their fifth birthday… they can join Reception class the school year before. They take Key Stage 2 tests in Year 6, and in most areas they transfer to secondary school for the start of Year 7, etc..
The UK pyramid shows a large age group at 30-34, with successively smaller age groups down to ages 15-19. That helps to explain that part of my career, the time of falling rolls, when we were having to remove surplus places. The larger size of the younger cohorts explains why we are now having to add places back. (Projections suggest a relatively stable period thereafter – we’ll see.)
Gronbach’s book is now over a decade old, and things have moved on. I would still commend it to those who are interested in generation theory, and an easy introduction to some basic ideas about population change.
Many district or unitary councils have names that immediately make sense to averagely well-informed natives – they are named after well known towns or cities (say, Doncaster or Middlesbrough) – but some can leave us guessing. Where is Shepway? Or Tendring? Or Bassetlaw? The first of those districts has recently taken steps to clarify matters… it has renamed itself Folkestone and Hythe. Most native Brits know Folkestone as a channel port, and as the place where the channel tunnel descends into the chalk connecting us to continental Europe. But why was the district ever called Shepway? Often these little known names are for districts which include several towns or centres of population, and where local politics would resist just one of them being prioritised by having the whole district named after it.
“Shepway” comes from the Anglo-Saxon period. A lathe was an ancient division of Kent and originated, probably in the 6th century, during the Jutish colonisation of the county. Angles, Saxons and Jutes colonised lowland Britain – what we would now think of as England – on the collapse of the Roman Empire. They were three Germanic groups originating in what we would now think of as northern Germany and Denmark (Jutland). Wikipedia tells us: “Etymologically, the word lathe may derive from a Germanic root meaning “land” or “landed possession”, possibly connected with the Greek word latron (“payment”). The lathe was an important administrative, judicial and taxation unit for 600 years after the Domesday Book.”
The current local authority district was formed as Shepway on 1 April 1974 by the merger of Folkestone, Hythe, Lydd and New Romney Boroughs along with Elham and Romney Marsh Rural Districts. “Shepway” would have seemed a reasonable compromise name, by drawing on a long historical pedigree that did not give undue prominence to any one of the previous councils. However, renaming the district as Folkestone and Hythe probably makes sense today.
Lathes were unique to Kent – suggesting (to me) that this organisation and terminology was associated with the Jutes. Other parts of the country had other forms of local administrative territories in the Anglo-Saxon period. The “hundred” was common in much of southern Britain.
I spend much of my time in Tendring district on the north Essex coast. Not many people will know where that is, but they may well have heard of the towns of Clacton-on-Sea, Frinton, or Harwich. As with Shepway, Tendring is a name which does not adjudicate which town is most important. It reverts to the name of the Saxon hundred of Tendring. The precise etymology of “hundred” is contested. It may once have referred to an area of 100 (or possibly 120) hides, though a “hide” is not a specific area: instead it was conceptually the amount of land required to support a family. Alternatively it may have been based on the area liable to provide 100 men under arms, or because it was an area originally settled by 100 men at arms. It has been suggested that this form of local organisation had been observed in Germany by Tacitus in the Roman period. Many districts in the south of England bearing names other than those of their principal town use the name of an old Hundred. Tendring being an example.
When the Vikings colonised the northern and eastern parts of Britain, they brought a similar form of local unit, but it was called a “wapentake”. The wapentake was the rough equivalent in the Danelaw of the Anglo-Saxon hundred. The word is possibly derived from a meeting place, usually at a crossroads or by a river, where one’s presence or vote was taken by the brandishing of weapons. According to some authorities, weapons were not brandished during a Norse assembly (known as a) but were allowed to be taken up again after the assembly had finished. It is also possible that it was just citizens who were entitled to possess weapons who were allowed to take part. Anyhow, Bassetlaw in north Nottinghamshire derives its name from the old wapentake, although most people would know the area better by reference to the names of one of its two principal towns, Worksop or Retford – two predecessor councils before the creation of the larger district.
Although some district names seem obscure there is usually a historical justification for them – often going back to the period between the collapse of the Roman empire and the arrival of the Normans in 1066. A little research can turn up some interesting information.
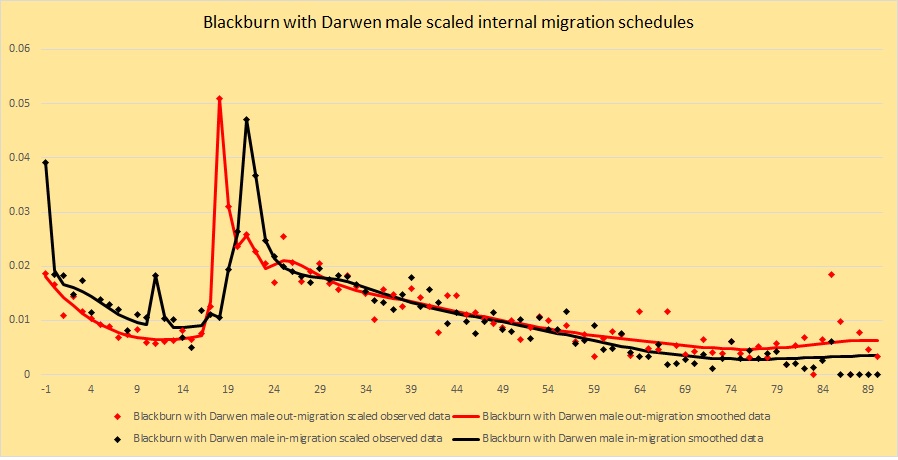
If we look at an age schedule of internal migration, how can we tell is a single outlying data point is signal or noise? We know that 18 year olds are highly likely to migrate, so a peak at that age is to be expected. Similarly, many young people move at age 21, either back to their parental home, or to a different district to take up employment or pursue further study. Boys attending “public schools” (i.e. elite fee-paying boarding schools) may move at age 13. But what if we see a peak at another age? When I came to look at the data for Blackburn with Darwen, a former cotton town in the north west, there appeared to be a peak at age eleven – was this signal or was it noise? There are two ways we might make a decision: first, does it appear repeatedly, year after year? If so, there is a good chance its a real phenomenon. Can we find external evidence that provides a plausible explanation for a peak at that age? Let us look at the out- and in-migration schedules for Blackburn.
Note the in peak at age 11 in Blackburn with Darwen
I was not aware of a well known public school in Blackburn, so I conducted a quick Google search on Blackburn… these were the top two results:
So it appears that there is a successful and popular boarding school in Blackburn. A check on the school’s website revealed that pupils are recruited at age 11 into Year 7. http://www.jamiah.co.uk/
This provides a plausible explanation for the eleven year old peak. Therefore it makes sense to include it in the model.
We have a confusing system of local government in England and Wales, or more particularly in England. First, we have potentially three or four layers of local government, except in some places where we have one or two. Second, local authorities keep reorganising themselves – the current trend is for amalgamations. Third, if they don’t like their name, local authorities can change it.
So what are the layers of local government in England? Let’s start with the ones that have the least power, the least money, and which will play no further part in this discussion – parish and town councils. A parish council has no formal connection with the church or religion. They are usually based on a large village. If they are based on a town they are called…. a town council. For example, Harwich in the district of Tendring, in the county of Essex, has Harwich Town Council. Even a city, such as Hereford, within the unitary council area of the County of Herefordshire has a Hereford City Council – but it only has parish council powers. They have very little money raising power. They often run a museum or a park, public toilets, or other community amenities. They are a statutory consultee in the planning process. Frequently their elected members do not have a party political affiliation. They exercise community leadership – and it is probably the giving of a local voice in the planning process that they can have most impact. They sometimes have a mayor and a few have an imposing building. However from the point of view of my current research on internal migration they are not immediately amenable to study using published data.
Map showing local authority districts in England and Wales
In much of the country the next level of local government is the district council… some of which are called borough councils, and a few of which are called city councils. What these all have in common is that they are lower tier councils within a non-metropolitan county. (I hope you are following this.) District councils are responsible for: waste collection, housing, planning, council tax collection, and a few other areas. They generally have elected members affiliated to political parties, although sometimes members fight on an independent ticket. So for example, New Forest, Fareham, Test Valley, Havant, and several others are district councils in Hampshire. Even Winchester City Council is a district council, with no more powers and responsibilities than any of the others. Above them sits Hampshire County Council, grandly accommodated in the Castle in Winchester. A non-metropolitan county council is responsible for education, social services, highways, strategic planning and other such services. These are the big spenders, and often have the biggest impact on people’s lives. County councils set a “precept” which means that they require district councils to collect a certain level of tax from their residents and hand it over. internal migration data is available for districts, so it is more straightforward to analyse it at that level. However not all parts of England have non-metropolitan councils. In some places, all the districts have agreed to be abolished, or have had their arms twisted… so for example, in Northumberland, Cornwall, Shropshire, Wiltshire, Herefordshire there is just one layer of local government (ignoring the parish, town, city councils for a minute) – so these are called unitary authorities. All the main local government functions sit with one council. This allows, potentially, for much more joined up decision making. It also means that these councils cover quite a large geographical area.
Now, it may not surprise you to know that there are other areas which are metropolitan counties. It may surprise you to know that they don’t generally benefit from an elected council. The metropolitan counties are Tyne and Wear, Teesside, West Yorkshire, South Yorkshire, Greater Manchester, Merseyside, and West Midlands (but don’t confuse the West Midlands metropolitan county, with the English region called West Midlands… that’s something different.) At one time there were metropolitan county councils, but they were abolished to simplify matters. Within each metropolitan county there are metropolitan boroughs, or sometimes cities, which hold most of the powers available to local government – like unitary authorities. So for example in Tyne and Wear there are five councils: Newcastle upon Tyne, Gateshead, Sunderland, North Tyneside and South Tyneside. There are similar arrangements in the other metropolitan counties.
London is a bit like a metropolitan county, except it isn’t. In London there are 32 London Boroughs plus the City of London. There used to be something called London County Council, but it was abolished in 1965 to make way for the Greater London Council, which was abolished in 1986 to be replaced by… nothing. Until the Greater London Authority was set up in 2000, with a directly elected mayor. The City of London, is absolutely tiny… yes, that’s right, it’s minute. It’s the second smallest district in England, after the really tiny Isles of Scilly which are in the Atlantic Ocean off the toe of Cornwall. The City of London is not the same as the large city most people think of as London. The City of London is basically the same area as the Roman city of Londinium – 2.9 square kilometres, commonly described as a square mile where the country’s banks and financial are based – including the Bank of England, Lloyds of London and the London Stock Exchange. About 5,000 people live there, but 500,000 come in every day to work. The city of London has all kinds of special powers of almost magical significance. Not only is the City of London a city in its own right, it is also a ceremonial county enclaved within the metropolis of London. Its cathedral, St Paul’s is a well known feature on the London skyline, alongside a number of new skyscrapers loosely inspired by vegetables such as the Gherkin, or household items, such as the walkie-talkie. It has its own police force separate from the Metropolitan Police. It has a special representative – the city remembrancer – in the Palace of Westminster (parliament) to try and ensure nothing is done there to upset the city. And the queen is not allowed into the city without permission. So there! The City of London corporation has some fancy officers including the chamberlain, the comptroller (don’t forget the “p”), a recorder, a common serjeant, three esquires: the city marshall, the sword bearer and the mace bearer, who doubles up as the common cryer, three ward beadles, and of course the Lord Mayor. The thirty two boroughs are much like metropolitan boroughs elsewhere in terms of their powers and responsibilities.
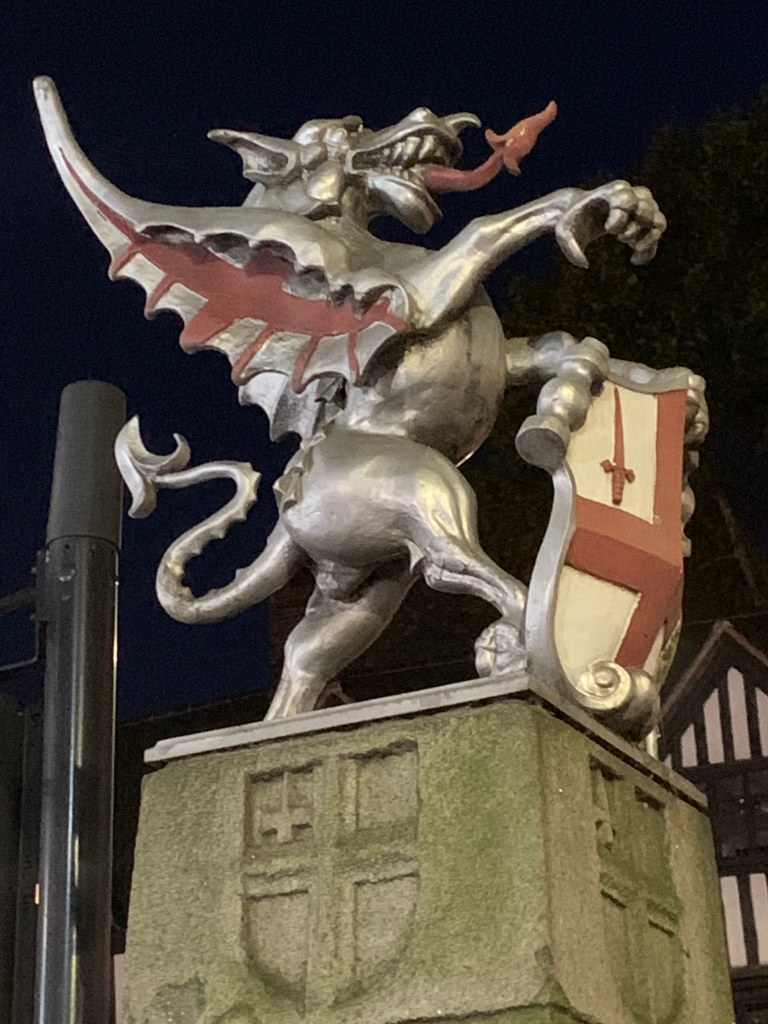
You know when you are entering the City of London, because you’ll pass one of these dragons
The thirty two London boroughs are realtively normal in comparison, with similar powers to metropolitan boroughs and unitary councils.
There are also a number of unitary councils across the country, mostly the bigger and most important cities and towns which are not part of the metropolitan set up… places like Leicester, Derby, Nottingham, Reading, Southampton, and Portsmouth. These control the majority of their own affairs.
To make matters more complicated there are now “elected mayors” for some, but not all, bigger geographies whose territories may, or may not, correspond to metropolitan, or non-metropolitan county boundaries.
From the point of view of internal migration it is the districts in non metropolitan councils, the metropolitan boroughs, and the unitary authorities, for which data is readily available. We’ll just call them local authority districts. If you move you place of usual residence between these districts you are counted as an internal migrant. Unless you move between England, Wales, Northern Ireland or Scotland, when you are described as a cross-border migrant. The three other countries of the UK have rather more straightforward systems of local government – with only one level of unitary councils. There is an additional complication in Wales, and parts of Scotland, where councils have names in English and Welsh or Gaelic… however this is not too complicated.
There was a period of stability between 1974 and 1996 when English local government was fairly stable. But in that year there were a number of reorganisations, and these have continued up to the present. In 2019 the old non-metropolitan county of Dorset was abolished, to be replaced with a new unitary council, comprising all the old districts with the exception of Christchurch. Christchurch joined together with its two neighbours to form a new unitary council called Bournemouth, Christchurch and Poole. The new council has a population of almost 396,000 making it by far the biggest urban council on the south coast. On the same date Suffolk Coastal District Council (Aldeburgh, Felixstowe etc.), combined with Waveney Council (Lowestoft) to form a new East Suffolk District Council, with a population of 240,000. It seems likely that there will be further changes to council boundaries in the future. Sometimes councils merely change their names. Recently Shepway District Council changed its name, because nobody knew where Shepway was… it is now Folkestone and Hythe Council on the channel coast of Kent.
From the perspective of population forecasting local authority districts are a key geographical unit. There is abundant data – demographic, social and economic – about districts. It is probably selfish to expect arrangements to stay the same for the convenience of demographers, but the constantly changing picture and inconsistent arrangements are a source of amusement, and sometimes frustration.