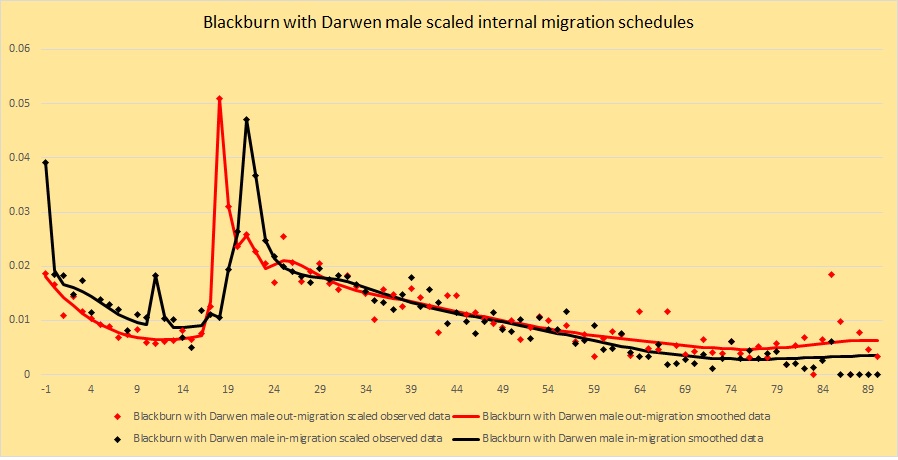
If we look at an age schedule of internal migration, how can we tell is a single outlying data point is signal or noise? We know that 18 year olds are highly likely to migrate, so a peak at that age is to be expected. Similarly, many young people move at age 21, either back to their parental home, or to a different district to take up employment or pursue further study. Boys attending “public schools” (i.e. elite fee-paying boarding schools) may move at age 13. But what if we see a peak at another age? When I came to look at the data for Blackburn with Darwen, a former cotton town in the north west, there appeared to be a peak at age eleven – was this signal or was it noise? There are two ways we might make a decision: first, does it appear repeatedly, year after year? If so, there is a good chance its a real phenomenon. Can we find external evidence that provides a plausible explanation for a peak at that age? Let us look at the out- and in-migration schedules for Blackburn.
Note the in peak at age 11 in Blackburn with Darwen
I was not aware of a well known public school in Blackburn, so I conducted a quick Google search on Blackburn… these were the top two results:
So it appears that there is a successful and popular boarding school in Blackburn. A check on the school’s website revealed that pupils are recruited at age 11 into Year 7. http://www.jamiah.co.uk/
This provides a plausible explanation for the eleven year old peak. Therefore it makes sense to include it in the model.
We have a confusing system of local government in England and Wales, or more particularly in England. First, we have potentially three or four layers of local government, except in some places where we have one or two. Second, local authorities keep reorganising themselves – the current trend is for amalgamations. Third, if they don’t like their name, local authorities can change it.
So what are the layers of local government in England? Let’s start with the ones that have the least power, the least money, and which will play no further part in this discussion – parish and town councils. A parish council has no formal connection with the church or religion. They are usually based on a large village. If they are based on a town they are called…. a town council. For example, Harwich in the district of Tendring, in the county of Essex, has Harwich Town Council. Even a city, such as Hereford, within the unitary council area of the County of Herefordshire has a Hereford City Council – but it only has parish council powers. They have very little money raising power. They often run a museum or a park, public toilets, or other community amenities. They are a statutory consultee in the planning process. Frequently their elected members do not have a party political affiliation. They exercise community leadership – and it is probably the giving of a local voice in the planning process that they can have most impact. They sometimes have a mayor and a few have an imposing building. However from the point of view of my current research on internal migration they are not immediately amenable to study using published data.
Map showing local authority districts in England and Wales
In much of the country the next level of local government is the district council… some of which are called borough councils, and a few of which are called city councils. What these all have in common is that they are lower tier councils within a non-metropolitan county. (I hope you are following this.) District councils are responsible for: waste collection, housing, planning, council tax collection, and a few other areas. They generally have elected members affiliated to political parties, although sometimes members fight on an independent ticket. So for example, New Forest, Fareham, Test Valley, Havant, and several others are district councils in Hampshire. Even Winchester City Council is a district council, with no more powers and responsibilities than any of the others. Above them sits Hampshire County Council, grandly accommodated in the Castle in Winchester. A non-metropolitan county council is responsible for education, social services, highways, strategic planning and other such services. These are the big spenders, and often have the biggest impact on people’s lives. County councils set a “precept” which means that they require district councils to collect a certain level of tax from their residents and hand it over. internal migration data is available for districts, so it is more straightforward to analyse it at that level. However not all parts of England have non-metropolitan councils. In some places, all the districts have agreed to be abolished, or have had their arms twisted… so for example, in Northumberland, Cornwall, Shropshire, Wiltshire, Herefordshire there is just one layer of local government (ignoring the parish, town, city councils for a minute) – so these are called unitary authorities. All the main local government functions sit with one council. This allows, potentially, for much more joined up decision making. It also means that these councils cover quite a large geographical area.
Now, it may not surprise you to know that there are other areas which are metropolitan counties. It may surprise you to know that they don’t generally benefit from an elected council. The metropolitan counties are Tyne and Wear, Teesside, West Yorkshire, South Yorkshire, Greater Manchester, Merseyside, and West Midlands (but don’t confuse the West Midlands metropolitan county, with the English region called West Midlands… that’s something different.) At one time there were metropolitan county councils, but they were abolished to simplify matters. Within each metropolitan county there are metropolitan boroughs, or sometimes cities, which hold most of the powers available to local government – like unitary authorities. So for example in Tyne and Wear there are five councils: Newcastle upon Tyne, Gateshead, Sunderland, North Tyneside and South Tyneside. There are similar arrangements in the other metropolitan counties.
London is a bit like a metropolitan county, except it isn’t. In London there are 32 London Boroughs plus the City of London. There used to be something called London County Council, but it was abolished in 1965 to make way for the Greater London Council, which was abolished in 1986 to be replaced by… nothing. Until the Greater London Authority was set up in 2000, with a directly elected mayor. The City of London, is absolutely tiny… yes, that’s right, it’s minute. It’s the second smallest district in England, after the really tiny Isles of Scilly which are in the Atlantic Ocean off the toe of Cornwall. The City of London is not the same as the large city most people think of as London. The City of London is basically the same area as the Roman city of Londinium – 2.9 square kilometres, commonly described as a square mile where the country’s banks and financial are based – including the Bank of England, Lloyds of London and the London Stock Exchange. About 5,000 people live there, but 500,000 come in every day to work. The city of London has all kinds of special powers of almost magical significance. Not only is the City of London a city in its own right, it is also a ceremonial county enclaved within the metropolis of London. Its cathedral, St Paul’s is a well known feature on the London skyline, alongside a number of new skyscrapers loosely inspired by vegetables such as the Gherkin, or household items, such as the walkie-talkie. It has its own police force separate from the Metropolitan Police. It has a special representative – the city remembrancer – in the Palace of Westminster (parliament) to try and ensure nothing is done there to upset the city. And the queen is not allowed into the city without permission. So there! The City of London corporation has some fancy officers including the chamberlain, the comptroller (don’t forget the “p”), a recorder, a common serjeant, three esquires: the city marshall, the sword bearer and the mace bearer, who doubles up as the common cryer, three ward beadles, and of course the Lord Mayor. The thirty two boroughs are much like metropolitan boroughs elsewhere in terms of their powers and responsibilities.
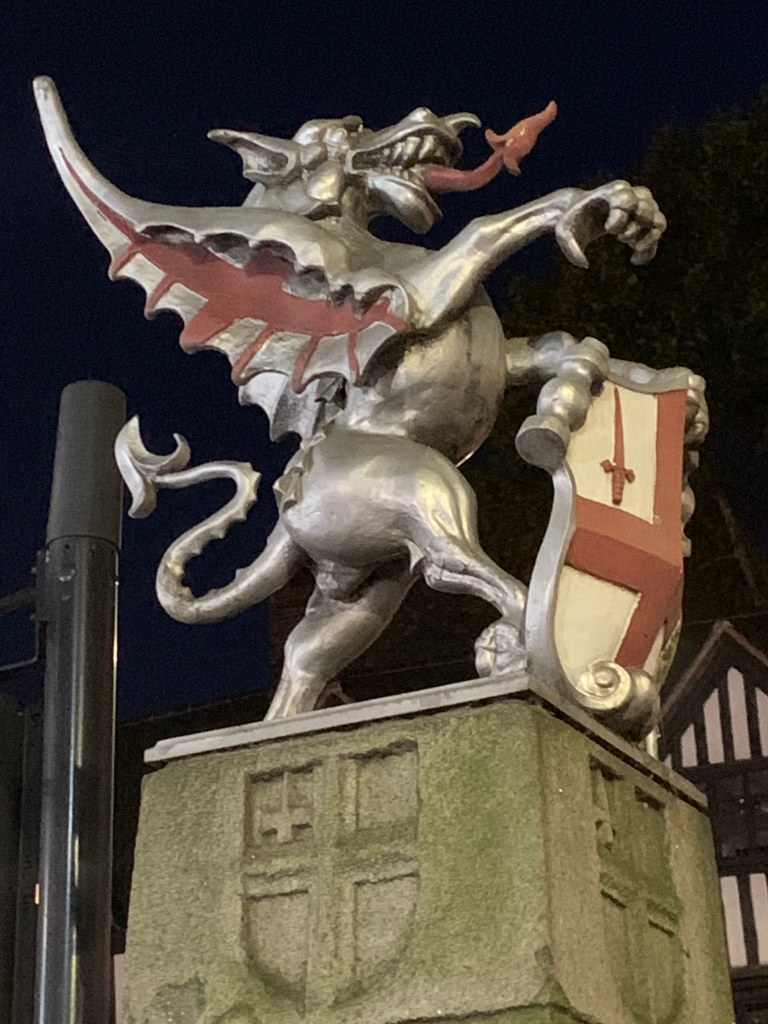
You know when you are entering the City of London, because you’ll pass one of these dragons
The thirty two London boroughs are realtively normal in comparison, with similar powers to metropolitan boroughs and unitary councils.
There are also a number of unitary councils across the country, mostly the bigger and most important cities and towns which are not part of the metropolitan set up… places like Leicester, Derby, Nottingham, Reading, Southampton, and Portsmouth. These control the majority of their own affairs.
To make matters more complicated there are now “elected mayors” for some, but not all, bigger geographies whose territories may, or may not, correspond to metropolitan, or non-metropolitan county boundaries.
From the point of view of internal migration it is the districts in non metropolitan councils, the metropolitan boroughs, and the unitary authorities, for which data is readily available. We’ll just call them local authority districts. If you move you place of usual residence between these districts you are counted as an internal migrant. Unless you move between England, Wales, Northern Ireland or Scotland, when you are described as a cross-border migrant. The three other countries of the UK have rather more straightforward systems of local government – with only one level of unitary councils. There is an additional complication in Wales, and parts of Scotland, where councils have names in English and Welsh or Gaelic… however this is not too complicated.
There was a period of stability between 1974 and 1996 when English local government was fairly stable. But in that year there were a number of reorganisations, and these have continued up to the present. In 2019 the old non-metropolitan county of Dorset was abolished, to be replaced with a new unitary council, comprising all the old districts with the exception of Christchurch. Christchurch joined together with its two neighbours to form a new unitary council called Bournemouth, Christchurch and Poole. The new council has a population of almost 396,000 making it by far the biggest urban council on the south coast. On the same date Suffolk Coastal District Council (Aldeburgh, Felixstowe etc.), combined with Waveney Council (Lowestoft) to form a new East Suffolk District Council, with a population of 240,000. It seems likely that there will be further changes to council boundaries in the future. Sometimes councils merely change their names. Recently Shepway District Council changed its name, because nobody knew where Shepway was… it is now Folkestone and Hythe Council on the channel coast of Kent.
From the perspective of population forecasting local authority districts are a key geographical unit. There is abundant data – demographic, social and economic – about districts. It is probably selfish to expect arrangements to stay the same for the convenience of demographers, but the constantly changing picture and inconsistent arrangements are a source of amusement, and sometimes frustration.
People in England and Wales move around quite a lot, which makes them hard to count, and makes it hard to forecast how many will be where in the future. The age at which people are most likely to migrate between local authority districts is 18 – by quite a big margin. 18 is the age at which individuals acquire most of their adult rights and responsibilities. It is also the most common age for enrolment into university for undergraduate degrees. Whilst some young people are able to continue to live in their family home and travel to a local institution, many choose to move away from home. The social opportunities of going to university, as well as the educational opportunities, are strong motivators. It is, for most, a partial transition. Many students will return “home” for the holidays, and maybe some weekends. They will often retain a circle of friends in their home town, they may keep their bedroom at home, and still have a sense of ownership of their pet dog, which is now walked by their middle aged parents. Not so long ago it was statistical convention that they be recorded as resident at their parents’ home, but for some time now the convention has been to regard them as resident in their university district – clearly in respect of some public services they have an impact in both places.
Whilst not all undergraduates start their studies at 18, the large majority do – hence the visible out-peak at that age in every local authority district. There is, of course, a corresponding in-peak in university districts. In districts dominated by higher education institutions, this is particularly marked. When I began my investigations I was surprised to find in-peaks in districts that I had not associated with universities: Oadby and Wigston (a suburban satellite of Leicester), Vale of White Horse (a rural and suburban district west of Oxford), and Broxstowe (an area of small mining towns and villages west of Nottingham). On investigation theses all proved to be districts where student halls of residence attached to the neighbouring university cities were located.
A typical residential trajectory for a student in England and Wales is from home to hall of residence at age eighteen, then to private rented accommodation the following year. This provides a gradual transition for the student (and the anxious parents). The hall of residence is likely to benefit from some supervision by the university and students’ union. It often provides a catering service, and deals with aspects of cleaning, repairs, etc.. Students usually live in single rooms within flats where there is some communal space including a kitchen. So the transition from being a dependent minor, to a (somewhat) independent adult is eased. By their second year students often move to a different type of accommodation. Sometimes this can be private sector student apartments (not dissimilar to halls of residence), or the “student house” – a normal residential house, often a Victorian terrace house, or a 1930s semi, where students live together in small groups, with very little supervision and much greater independence, both from parental and university control. Typically these student house areas are more urban than the halls of residence areas – so from leafy Oadby and Wigston to Leicester, from Vale of White Horse to Oxford city, from Broxstowe to Nottingham. This can produce a strong single year peak of migration as students move from one district to another – even if it is only a mile or two. (The resulting schedules of migration between Leicester and Oadby and Wigston can be seen in my post of 1st January 2020 “A Year of exciting demography ahead”.)
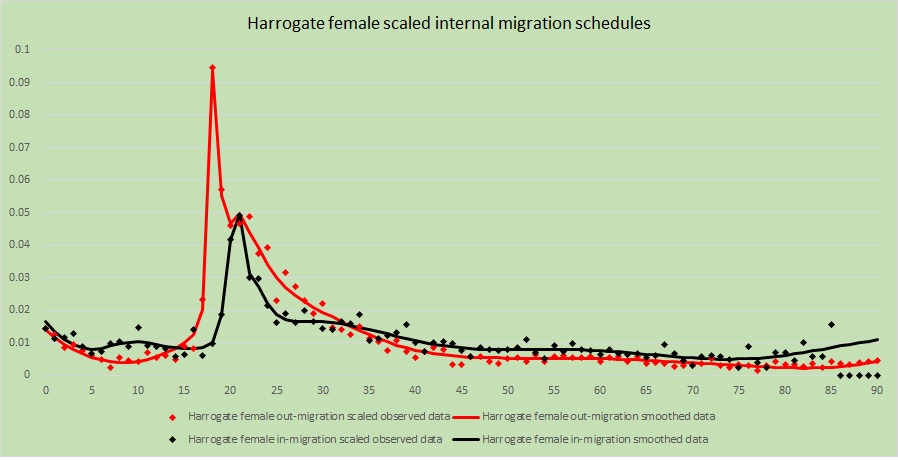
Most districts show an in-peak at 21 – likely to be graduates returning “home” after university, plus graduates taking up employment. The following example is from Harrogate, an attractive spa town in North Yorkshire.
Note the out-peak at 18 and the in-peak at 21
The English and Welsh education systems are strongly structured by age. Children are obliged to be in full time education from the term after their fifth birthday. For most this means school, and it is usual to start in a “reception” class the year before as a four year old. Schools and local education authorities tend to be resistant to educating children outside their chronological age group, and will often only do so with the support of a (hard to obtain) recommendation from an educational psychologist. This means that children move through the school system in age cohorts, transferring from primary to secondary school the September after their eleventh birthday, and moving from statutory secondary education to slightly less statutory “sixth form” or further education at 16. Nearly all young people finish their schooling in the year of their eighteenth birthday, and for those that are going to move on to higher education, 18 is the most likely age to make that transition.
For the modeller of age schedules of migration this presents as challenge: we often want to remove noise – random age to age fluctuations in migration levels – but these sharp single year peaks are not noise, but signal. Childhood migration extends over several years, and can often be modelled as a negative exponential curve, and retirement migration is a phenomenon that can be observed as a shallow hump over the years of later middle age and early old age. However the education driven migration curves often focus on just a single year. Another phenomenon in England which applies to a small number of districts is the “public school peak” observed at age 13 amongst boys.
A public school in England is not a state school, but rather a fee-paying independent school, often established many hundreds of years ago. The most famous include Eton, Harrow and Winchester. The small district of Rutland, England’s third smallest district by population (just below 40,000) has a public school in both of its towns: Oakham and Uppingham.
A marked in-migration peak can be seen at age 13 as boys arrive at the two public schools. The height of the out-migration peak at 18 is likely to be enhanced by the two schools, as their pupils go to university, or return to their family home – either way almost certainly leaving Rutland. Modelling these peaks is clearly essential.
So, in conclusion, migration schedules in England and Wales requires modelling phenomena that extend over a range of age groups, and single year peaks, most often associated with educational institutions where there is a residential component. It would certainly be a mistake to regard these peaks as “noise” to be smoothed out. They are an important part of the signal.